Coffee Quality Analysis
This project focused on identifying characteristics of higher-quality coffee. The analysis could be used by a coffee shop to aid in sourcing the best coffee possible. This could give the coffee shop an edge in a competitive market.
Tools
Tableau
PyCharm
Python (Pandas, Seaborn, Matplotlib, Sklearn, Statsmodel)
Skills
Data Wrangling / Cleaning
Heatmaps & Correlations
GeoJSON Geographical Analysis
Supervised Machine Learning: Regression
k-Means & Unsupervised Machine Learning: Clustering
Time Series Analysis
Storyboarding
My Process
This data set was interesting because I wasn’t able to find significant correlations at the start. Once I performed a geographical analysis, I was able to identify a subset. Once I re-performed my analysis with this subset, I was able to uncover significant relationships and correlations.
Initial Exploratory Data analysis Proves Inconclusive
After cleaning and wrangling the data, I began to perform my first round of Exploratory Data Analysis (EDA). This included creating correlation matrix heatmaps, scatterplots, pair plots, and categorical plots. The findings in this first round of analysis were inconclusive.
Note: The linear relationships exhibited here are between the various coffee evaluations which add up to the total coffee score (i.e. flavor, aroma, etc.). These are not pertinent to our analysis. We’re interested in the total coffee score and the role that outside variables like location, variety, etc. has on that score, not each individual evaluation.
Geographical Analysis Reveals A Possible Subset
When I finally turned my analysis to geography, I was able to identify a possible subset of “top countries.” This subset consisted of Ethiopia, Tanzania, Guatemala and Taiwan. Before I dove into this subset, I continued my analysis on the whole data set to see if I could find any last relationships.
Our Subset Yields Substantial Findings
When we looked at linear and clustering models with the whole data set, we could not find any conclusive discoveries.
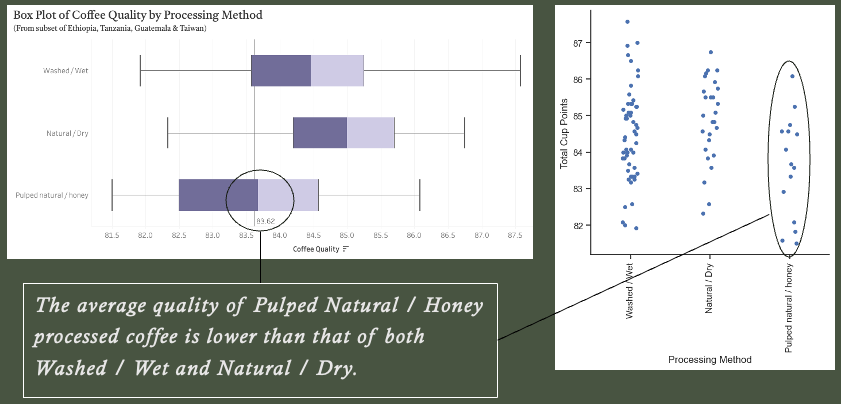
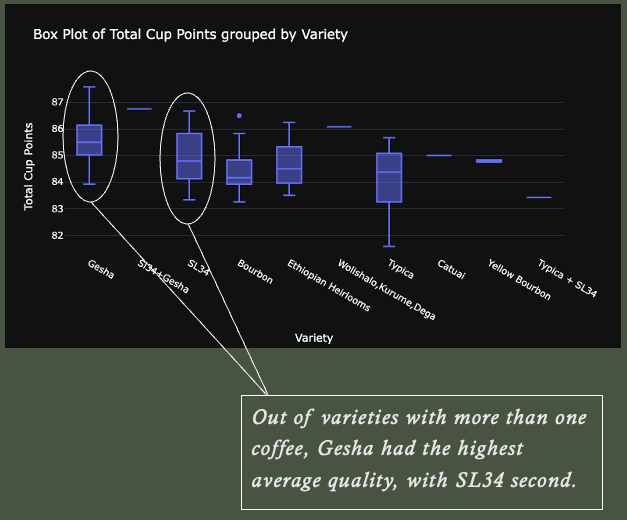
However, when we returned to our subset that included Ethiopia, Tanzania, Guatemala and Taiwan. We performed our initial EDA again and were able to uncover significant relationships in the data. First, we found connections between variety/processing method and coffee quality.
Clustering Analysis Findings With The Subset
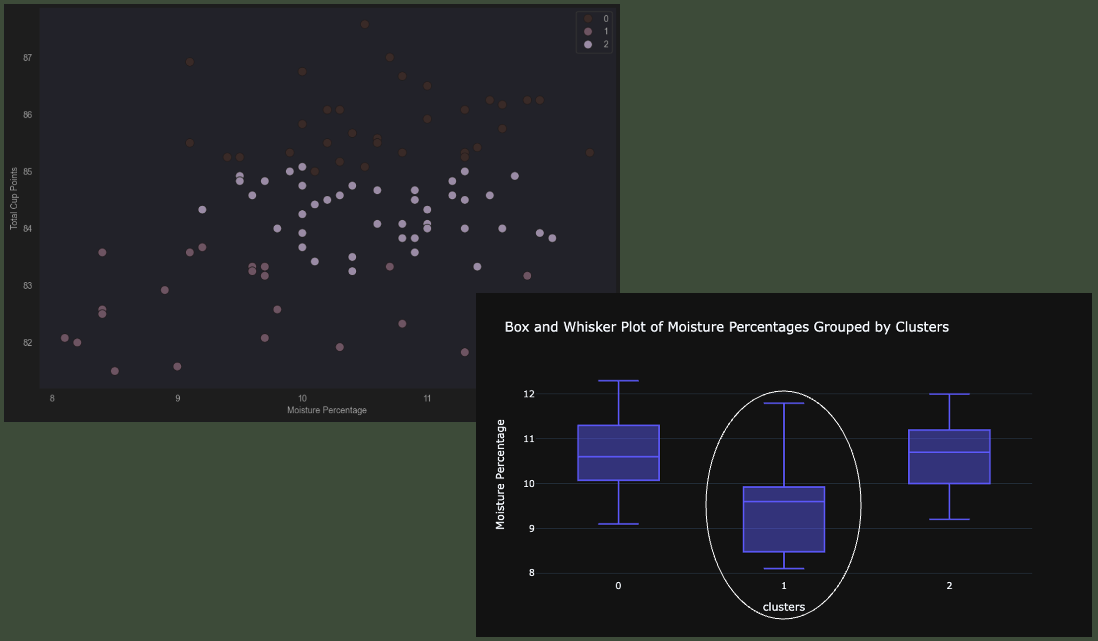
Lastly, we returned to our regression and cluster analysis. Once again, our data lacked linearity which resulted in failed regression modeling. However, we were able to find significant correlations when we looked at clustering. We were able to make deductions about how altitude and moisture percentage affect coffee quality.
In both cases, Cluster 1 stood out significantly from the others. This led us to determine that higher altitudes around 1,200m and a moisture percentage over 9% leads to higher-quality coffee.
Results
With our analysis complete, we were able to determine that the following characteristics should be considered when attempting to source the highest-quality coffee:
Coffees that originate from Ethiopia, Tanzania, Guatemala and Taiwan
Coffees that use a Washed / Wet or Natural / Dry processing method
Coffees of Gesha or SL34 variety type (with potential consideration for Gesha+SL34 hybrid variety)
Coffees originating from an altitude around 1250m
Coffees with a moisture percentage over 9%
Click here to see the Tableau Storyboard.


